Strategic Conflicts and the Structural Repricing of Global Energy Chokepoints: A Market Taxonomy (1946–2026)
SECTION 1 — THE PRESENT
On June 18, 2026, the United States and the Islamic Republic of Iran executed a 14-point memorandum of understanding, transitioning a military conflict that commenced on February 28 into a highly volatile diplomatic framework. While the United States launched its initial military campaign with the stated objective of Iran’s unconditional surrender, the negotiated settlement at the Bürgenstock Resort in Switzerland established a structurally different reality for global capital markets.
Brokered through Pakistani and Qatari mediation, the Bürgenstock talks did not deliver a finalized peace treaty, but rather an interim 60-day roadmap. To secure this pause, Washington executed a massive diplomatic concession: the US Treasury issued a general license waiving sanctions on Iranian oil and petrochemical exports until August 21. Under the specific terms of the settlement, Iran retains its domestic uranium enrichment capabilities on-site, with the material subject to down-blending under the supervision of the International Atomic Energy Agency.
Critically for global maritime infrastructure, the agreement codifies a new baseline for the Strait of Hormuz. The Iranian government explicitly classifies upcoming transit charges as "service fees" rather than tolls, a deliberate legal distinction designed to navigate the parameters of international maritime law. While the memorandum guarantees free passage through the waterway for an initial 60-day period, this is explicitly temporary. The main navigational channel remains closed pending the clearance of approximately 80 explosive mines, confining current transit to narrow northern and southern coastal routes. Following the interim window, the future administration of maritime services is subject to bilateral negotiation between Iran and Oman.
President Donald Trump described the fee arrangement as "a beautiful thing" and floated the possibility of a joint venture between the United States and Iran to manage the strait.
The resolution of the 2026 conflict formalized a fundamental alteration in the architecture of global energy transport. By examining the empirical data of the past seven decades, it becomes evident that the terms established in Switzerland do not merely pause a regional dispute. They represent the maturation of a new class of strategic conflict, introducing a novel mechanism for the extraction of permanent economic rent from global capital markets.
SECTION 2 — THE FRAMEWORK
A rigorous examination of the historical record demonstrates that the commonly held assumption—that oil-strategic conflicts uniformly result in sustained oil price spikes—is not supported by the data. The pricing signal generated by military and geopolitical friction in energy-producing regions over the past 70 years is decidedly mixed. This mixed signal is not a reflection of market inefficiency, but rather the primary analytical finding of this research. The market's response to geopolitical friction is entirely dependent on the specific mechanism of disruption, and the taxonomy detailed below explains why the signal presents as it does.
This paper utilizes a three-type taxonomy of oil-strategic conflict and market response. The taxonomy categorizes conflicts based on how the participants interact with supply infrastructure, and how that interaction is subsequently priced by global capital markets.
TYPE 1 — SUPPLY WEAPONIZATION
In this classification, the producing nation or cartel weaponizes supply itself, deliberately cutting or embargoing output as a direct act of economic warfare. This mechanism structurally removes physical volume from the market to achieve political objectives. The defining market response is permanent floor repricing. The market cannot revert to pre-conflict pricing levels because the supply mechanism has been structurally recalibrated, permanently altering the marginal cost of production and the baseline risk premium. The definitive historical example is the 1973 OPEC embargo, wherein the nominal price of oil moved from $3.56 per barrel in July 1973 to $10.11 by January 1974, establishing a floor that the asset never returned below.
TYPE 2 — KINETIC CONFLICT NEAR SUPPLY INFRASTRUCTURE
This category encompasses military conflict that occurs in or near oil-producing or transporting regions, but where supply is not explicitly utilized as a weapon by the combatants. This produces a distinct spike-and-reversal pattern in the asset class. The initial price increase represents a fear and risk premium, which dissipates rapidly when the conflict resolves, when supply routes are secured, or when alternative production is brought online. Because the underlying supply mechanism is not structurally altered or permanently removed, there is no permanent floor repricing. Historical examples include the 1991 Gulf War, the 2003 Iraq invasion, and the 2011 Libyan intervention.
TYPE 3 — CHOKEPOINT MONETIZATION (2026, NEW)
This structural innovation occurs when a controlling party converts the temporary weaponization of a critical supply chokepoint into a permanent toll or fee mechanism. This scenario represents neither the full market closure of Type 1 (as physical supply is not permanently cut) nor the clean mean reversion of Type 2 (as the chokepoint does not return to pre-war operational conditions). Instead, a permanent embedded cost is introduced into global energy supply chains without eliminating the underlying physical supply. The 2026 conflict between the United States and Iran over the Strait of Hormuz is the inaugural manifestation of this type.
An analysis of the primary quantitative data
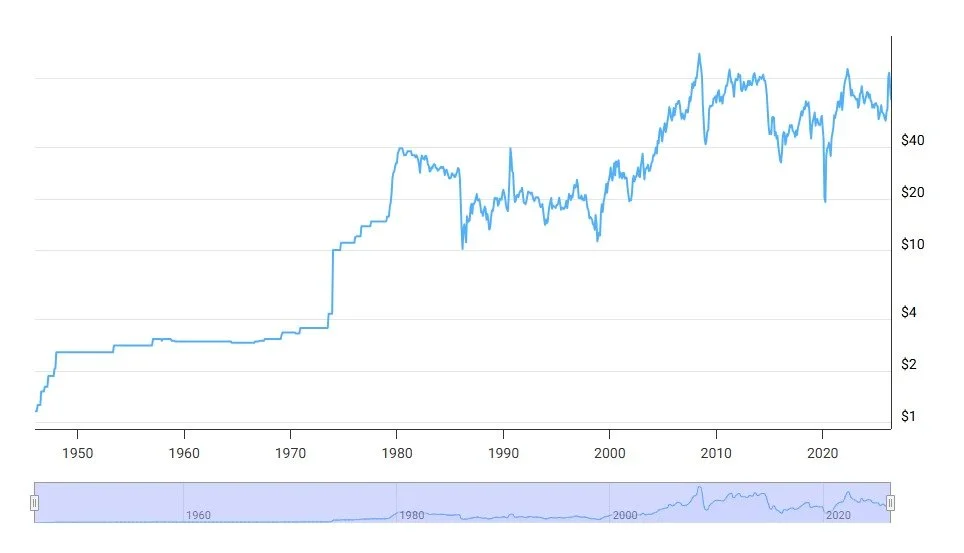
— inflation-adjusted monthly oil price series from 1946 through June 2026
reveals several directly observable features that validate this specific taxonomy. First, the 1973 floor repricing is the only event in the entire 70-year dataset that produced a permanent, structural step-change in the oil price floor. Second, the 1980–1988 Iran-Iraq War period demonstrates a sustained decline in oil prices despite nearly a decade of active kinetic conflict in the world's primary producing region, representing the exact inverse of the conventional market assumption. Third, the 1990–1991 Gulf War produced a violent price spike that reverted fully to pre-conflict levels within a matter of months, exhibiting classic Type 2 behavior. Finally, the 2026 Hormuz conflict produced a spike that has only partially reverted, failing to return to pre-war levels as of the data end date, indicating the pricing of a novel structural premium characteristic of Type 3.
SECTION 3 — THE EVIDENCE: CASE STUDIES
To validate the taxonomy, the following historical case studies are classified and analyzed based on their mechanistic interaction with global energy supply chains and their subsequent price behavior. The weight of the analysis corresponds strictly to the structural significance of the event in establishing or proving the analytical framework.
A. Suez Crisis (October–November 1956)
The nationalization of the Suez Canal by Egypt and the subsequent military intervention by Israel, the United Kingdom, and France represents a weak case of Type 2 dynamics. Throughout the duration of the conflict, crude oil prices exhibited no meaningful movement in the monthly data series. Prices remained entirely static at $2.82 per barrel throughout 1956, only adjusting marginally to $3.07 in February 1957 following the resolution of the crisis. The conflict was resolved diplomatically before the disruption to the supply route became a structural deficit. Analytically, it must be noted that Western capital markets were not sufficiently integrated or financialized in 1956 to produce a clean, responsive financial market signal even if physical supply had been more severely dislocated. Consequently, while the event fits the parameters of a kinetic conflict near infrastructure, its utility as a primary analytical data point is limited.
B. 1973 Yom Kippur War and OPEC Embargo (October 1973 – March 1974)
The 1973 crisis stands as the definitive historical example of Type 1 supply weaponization. Following the outbreak of the Yom Kippur War, Arab members of the Organization of Petroleum Exporting Countries (OPEC) instituted an embargo against nations supporting Israel, deliberately removing millions of barrels per day from the global market.
The quantitative data shows a violent and permanent regime shift. Oil prices, which stood at $3.56 per barrel in July 1973, accelerated to $10.11 by January 1974, and subsequently to $11.16 by late 1974. The price never returned below the $10 threshold, fundamentally altering the baseline economics of global energy consumption.
A critical analytical distinction must be established: the OPEC embargo was not a war. It was a supply weapon deployed in response to a war. The Yom Kippur War itself was a kinetic conflict (Type 2); it was the subsequent, deliberate political decision by OPEC to weaponize supply that produced the permanent repricing, elevating the event to Type 1.
The economic transmission mechanism of this weaponization is meticulously documented in macroeconomic literature. Research by James Hamilton demonstrates that by 1973, petroleum had become deeply integrated into core economic sectors, transitioning from an illuminant to the primary input for industrial production and transportation. The physical supply shortfall—exacerbated by domestic price controls in the United States—resulted in severe downstream disruptions, consumer rationing, and a sharp contraction in automotive manufacturing and sales. This specific transmission mechanism translated the supply shock directly into a macroeconomic contraction, serving as a primary catalyst for the 1973–1975 recession. While the Standard & Poor's 500 Index experienced a severe bear market during this period, attribution remains highly complex due to concurrent macroeconomic variables, including the collapse of the Bretton Woods system of dollar convertibility in 1971, the economic drain of the Vietnam War, and the domestic political instability surrounding the Watergate scandal. Therefore, the analytically clean data point proving the Type 1 taxonomy is the permanent establishment of the new oil price floor, rather than the equity market drawdown.
C. Iranian Revolution and Iran-Iraq War (1979–1988)
This decadal period requires careful analytical disaggregation, as it comprises two mechanistically distinct sub-events that affected the market in fundamentally different ways. This is a transition case that clearly illustrates the boundary between physical capacity collapse and kinetic conflict.
The Iranian Revolution of 1979 resulted in a functional collapse of the nation's hydrocarbon output. Iranian crude oil production fell dramatically from approximately 5.3 million barrels per day in late 1978 to 1.47 million barrels per day by the end of 1980. While this was not a deliberate, weaponized embargo orchestrated to extract geopolitical concessions, it was functionally Type 1-adjacent, operating via the mechanism of massive supply removal through institutional collapse. The market responded to this structural deficit accordingly: prices rose from $14.85 in late 1978 to $38.00 by early 1980.
The subsequent eight-year Iran-Iraq War (1980–1988) presents the clearest proof of the taxonomy's core premise regarding Type 2 events: active conflict without supply weaponization does not produce sustained price increases. Despite two major OPEC producers engaging in total war within the world's primary producing region, oil prices declined steadily throughout the mid-1980s, eventually collapsing to $10.25 per barrel by March 1986.
This inverse price action occurred because the global energy system possessed redundancy, and that redundancy was deliberately activated. Fearing the geopolitical consequences of Iranian expansion and seeking to stabilize global markets, Saudi Arabia ramped up its crude oil production, reaching 10.27 million barrels per day by 1980. Because supply was not deliberately withheld by the broader producing bloc, the kinetic conflict failed to generate a structural price premium. The eventual 1986 price collapse was the delayed market response to the adversarial dynamic established in 1973; consuming nations had aggressively diversified their supply sources and increased energy efficiency, while Saudi Arabia eventually lost internal production discipline in a bid to reclaim market share.
D. Gulf War (August 1990 – February 1991)
The Iraqi invasion of Kuwait in August 1990 provides the dataset's cleanest example of short-cycle Type 2 dynamics. The invasion immediately threatened critical Persian Gulf supply infrastructure, generating a rapid fear and risk premium.
An analysis of the daily West Texas Intermediate (WTI) data illustrates the exact trajectory of this risk premium. Oil prices spiked from a baseline of $17.05 in June 1990, accelerating through August to reach a peak of $39.53 by late September 1990. However, the mechanism of supply weaponization was absent. The military response by the international coalition was rapid, infrastructure was secured before it could be permanently degraded, and alternative suppliers immediately activated spare capacity. By February 1991, as the conflict reached its kinetic resolution, the price of oil reverted entirely, dropping back to $19.28. Because the supply disruption was transient and not structurally weaponized by the controlling authorities, there was no permanent floor repricing.
E. 2003 Iraq Invasion (March–May 2003)
The 2003 invasion of Iraq further validates the Type 2 classification, demonstrating how risk premiums dissipate when infrastructure threats fail to materialize. Anticipation of the conflict generated a modest risk premium in early 2003, with prices reaching $36.78 in February. However, as the coalition advance proved rapid and initial fears of widespread infrastructure sabotage by retreating Iraqi forces failed to materialize, the risk premium collapsed. Oil prices actually fell during the primary kinetic phase of the invasion, dropping to $26.09 by April 2003.
It is a common analytical error to conflate the market impact of the 2003 invasion with the subsequent, sustained rise in oil prices from 2003 to 2008, which peaked at nearly $140 per barrel. That multi-year price appreciation was driven entirely by structural macroeconomic factors—specifically unprecedented Chinese industrial demand growth, the emergence of the commodity supercycle, and widespread peak oil discourse—and was not a conflict-driven premium.
F. 2011 Libya Intervention (March–October 2011)
The civil war and international intervention in Libya in 2011 represents a weak Type 2 case. The conflict resulted in the shut-in of approximately 1.2 million barrels per day of Libyan production. While this generated a localized price spike in early 2011, pushing prices from $90.99 in January to $113.39 in April, Libya's production volume was insufficient to move global markets structurally on its own. The disruption was actively mitigated when the International Energy Agency coordinated the release of 60 million barrels from emergency strategic stocks. The elevated price environment during this period was primarily embedded within broader regional uncertainty stemming from the Arab Spring, rather than the specific kinetic events in Libya, and should not be over-weighted in the taxonomy.
G. 2022 Russia-Ukraine Full Invasion (February 2022 – ongoing)
The Russian full-scale invasion of Ukraine serves as the critical bridge case in the dataset. It sits analytically between Type 1 and Type 2, operating as the direct precedent that makes the 2026 Type 3 anomaly legible.
The initial oil market behavior followed a classic Type 2 pattern: Brent crude spiked from $89.16 in January 2022 to a peak of $114.38 in May 2022, before experiencing a partial mean reversion to the $70–$90 range by late 2022 and throughout 2023. The oil price did not undergo a permanent floor repricing.
However, the true regime shift occurred in natural gas and European energy infrastructure. Here, an important analytical distinction must be made: the direct economic leverage Russia wielded against the European Union was fundamentally self-induced. Russia did not merely execute a sudden, hostile withdrawal of gas. Instead, European policymakers and industrial conglomerates spent decades structurally optimizing for low-cost pipeline inputs, voluntarily dismantling their own energy redundancy in pursuit of immediate margin expansion. This intense concentration of supply calcified into actionable leverage. When Russia eventually weaponized this flow—systematically reducing pipeline deliveries to the EU by 80% by October 2022—it was leveraging a structural dependency that the consuming bloc had voluntarily constructed.
The market response was an emergency structural infrastructure shift rather than a pure price shift. Forced to break its acute price-addiction, the European Union redirected its energy supply chains under the REPowerEU mandate, accelerating liquefied natural gas (LNG) import capacity, executing a complete reversal of German energy policy (the Energiewende restructuring), and establishing strict mandates for emergency gas storage. This dynamic—the leveraging of a self-induced dependency trap to extract geopolitical concessions, triggering a costly structural infrastructure response in the consuming bloc without causing a 1973-style global floor repricing—established the strategic playbook that Iran would perfect in 2026.
| Conflict Event | Taxonomy Classification | Dates | Oil Price Behavior | Market Outcome |
|---|---|---|---|---|
| Suez Crisis | Type 2 (Weak) | Oct–Nov 1956 | Static ($2.82) | No structural impact; pre-financialization |
| OPEC Embargo | Type 1 (Definitive) | Oct 1973–Mar 1974 | $3.56 → $10.11 | Permanent floor repricing |
| Iranian Revolution | Transition (Type 1 adj.) | 1978–1979 | $14.85 → $32.50 | Output collapse; price floor elevated |
| Iran-Iraq War | Type 2 (Inverse) | 1980–1988 | $39.50 → $13.33 | Redundancy activated; multi-year price decline |
| Gulf War | Type 2 (Clean) | Aug 1990–Feb 1991 | $17.05 → $39.53 → $19.28 | Clean spike-and-revert; no floor repricing |
| Iraq Invasion | Type 2 | Mar–May 2003 | $36.78 → $26.09 | Risk premium collapsed during invasion |
| Libya Intervention | Type 2 (Weak) | Mar–Oct 2011 | $90.99 → $113.39 → $93.19 | Offset by IEA reserve release |
| Russia-Ukraine | Bridge Case | Feb 2022–Ongoing | $89.16 → $114.38 → $73 (at the moment of writing) | Permanent shift in EU energy infrastructure |
| Hormuz Conflict | Type 3 (New) | Feb 2026–Ongoing | $57.26 → $108.64 → $73 (at the moment of writing) | Permanent chokepoint monetization potential |
SECTION 4 — 2026: THE ANOMALY
The 2026 conflict between the United States, Israel, and Iran represents the centerpiece of this analysis. The sequence of events, and specifically their resolution, introduces a structural anomaly that breaks the established historical taxonomy, requiring the codification of Type 3: Chokepoint Monetization.
The sequence opened as a textbook Type 2 event. On February 28, 2026, the United States and Israel initiated kinetic airstrikes against Iranian military infrastructure, nuclear facilities, and the Islamic Revolutionary Guard Corps (IRGC). The market response was immediate and aligned perfectly with the historical pattern for kinetic conflict near infrastructure: oil prices moved from a baseline of $57.26 in December 2025 to $64.50 in January, and accelerated rapidly to $102.86 in March and $108.64 in April 2026. This initial $50 variance represented a classic fear and risk premium, pricing in the potential destruction of physical supply assets.
The conflict's trajectory shifted violently when Iran executed a de facto closure of the Strait of Hormuz. Within 24 hours of the initial strikes, commercial traffic through the corridor—which historically carried a fifth of global crude oil—fell by 80%. According to marine war risk data from Howden Group, approximately 750 vessels were stranded on either side of the strait, trapping 11,000 seafarers and an estimated $15.3 billion of oil and gas. This closure threatened to convert the event into a definitive Type 1 scenario, representing the first physical closure of a vital maritime chokepoint in the 70-year dataset. The market's pricing at the $108.64 peak in April 2026 reflected the severe probability of prolonged, structural supply weaponization.
However, the conflict entered a mediation phase brokered by Pakistan and Qatar, culminating in a 14-point preliminary MoU signed in Geneva and advanced into a highly volatile 60-day interim roadmap at the Bürgenstock Resort on June 21, 2026.
It is the specific outcome of this ongoing settlement that breaks the historical taxonomy. The Bürgenstock negotiations did not mandate a return to pre-war operational conditions in the Strait, nor did they result in the total withdrawal of physical supply. Instead, Iran successfully converted the threat of a Type 1 closure into a permanent, institutionalized revenue mechanism, without executing the closure long enough to trigger the macroeconomic destruction and subsequent demand destruction characteristic of 1973.
The fragility and structural intent of this arrangement were explicitly demonstrated over the weekend of June 20-21. Citing Israeli military actions in Lebanon, Iran executed a brief re-closure of the Strait. Maritime intelligence confirmed vessel transits plummeted to just 12 per day, with AIS systems going dark across the corridor. This flash-event forced immediate diplomatic concessions at the Bürgenstock talks, resulting in the 60-day roadmap and the US Treasury issuing temporary oil sanctions waivers until August 21. Iranian Parliament Speaker Mohammad Bagher Ghalibaf explicitly codified the new taxonomy during these negotiations, stating: "the administration of the strait will never return to the way it was before the war."
The physical reality of the Strait enforces this new diplomatic architecture. The main central shipping channel remains impassable, blocked by approximately 80 explosive mines laid during the conflict. Vessels are currently forced to navigate through narrow northern routes hugging the Iranian coast, or southern routes along the Omani coastline. While the interim agreement guarantees free passage with no charges for 60 days, this is explicitly a temporary waiver, followed by bilateral negotiations between Iran and Oman regarding the permanent "future maritime services administration". Iran has acquired the recognized authority to introduce "service fees," calibrated at approximately $1 per barrel, or up to $2 million per supertanker.
The analytical argument regarding this outcome is clear: the Iranian state learned from the long-term consequences of 1973, as well as the Russian dependency trap of 2022. Supply weaponization via a total embargo generated massive short-term rent extraction in the 1970s, but it also catalyzed a structural, permanent response from consuming nations, driving them to break their dependency. By contrast, Russia’s 2022 strategy demonstrated that the most effective leverage is one where the consumer is an active accomplice in their own vulnerability, choosing cheap, convenient supply paths over expensive redundancy.
Chokepoint monetization (Type 3), therefore, operates as the ultimate realization of this dependency logic. It achieves the strategic objective of rent extraction without triggering the destructive substitution response that dismantled OPEC's 1970s monopoly. The mechanism succeeds precisely because the market is too addicted to the efficiency of the Hormuz corridor to pursue costly alternatives. Physical supply continues to flow; ships pay the toll, oil moves to market, and the controlling state profits. The revenue stream is highly durable because, at the calibrated fee of $1 per barrel, paying the rent is marginally more rational than the massive capital expenditure required to bypass the chokepoint entirely. This asymmetric cost dynamic is starkly visible in the Bürgenstock settlement itself, where Washington was forced to structure and sponsor a $300 billion internationally capitalized reconstruction framework tied to performance metrics. While avoiding direct US Treasury outlays, the political capital expended by the US to facilitate this liquidity mechanism has triggered severe domestic friction, underscoring the price of pacifying the chokepoint.
Against the threat of further capital destruction on that scale, paying the toll is rational. To execute the toll collection, Iran established a new legal framework. As confirmed by maritime intelligence in Lloyd's List, Tehran created the Persian Gulf Strait Authority (PGSA) to mandate routing, enforce mandatory insurance, and collect "service fees" covering navigational assistance and environmental protection. By classifying these charges as services rather than tolls, Iran is utilizing UNCLOS Article 26(2) to provide a veneer of international legal compliance, prohibiting tolls for mere passage but allowing charges for "specific services rendered".
The primary oil price data confirms the emergence of this hybrid Type 3 pricing model. Driven by the weekend volatility and the Bürgenstock talks, Brent crude spiked to a peak of $81.80 on the threat of re-closure, then settled at $77.61 upon the announcement of the 60-day roadmap and Treasury waivers (with WTI trading in tandem, peaking at $77.83 and settling at $73.73). The asset has not returned to the $57.26 pre-war baseline, confirming that the market is currently pricing in a permanent embedded cost and elevated risk floor. Yet, it has not maintained the $108.64 peak levels of April, confirming that the market does not believe supply is structurally interrupted. This $77 print represents textbook Type 3 pricing: the application of a partial, permanent premium, avoiding both full floor repricing and clean mean reversion.
SECTION 5 — THE MARKET CONSEQUENCE
The formalization of chokepoint monetization presents profound structural implications for global capital markets. The transition from free maritime transit to a toll-based system introduces several permanent alterations to energy economics that extend far beyond the localized geography of the Persian Gulf.
A. Permanent Hormuz Risk Premium
The fundamental assumption that underpinned energy markets for decades—the guarantee of free, unimpeded transit through international straits—has been voided. The establishment of a joint US-Iran "communication line" and a Lebanon "de-confliction cell" to manage the corridor proves the Strait is now a managed vulnerability, not an open passage. Even during the 60-day "free passage" window, the market must permanently price the credible threat of reclosure differently than it did prior to February 2026. The marine insurance market has already registered this regime shift. War risk premiums surged to 2.5% of a vessel's hull value per seven-day period during the peak conflict, and post-ceasefire rates remain highly elevated at approximately 1%. Capital markets must now permanently underwrite the risk that the Strait operates under a conditional matrix.
B. Embedded Cost in Energy Supply Chains
If the proposed "service fee" structure is formalized following the 60-day negotiation period, it will embed a structural floor into the production and transportation costs for all exporters utilizing the Persian Gulf. This bureaucratic entrenchment is actively underway; following the Bürgenstock talks, top Iranian negotiators immediately deployed to Muscat. Oman is now actively brokering the long-term "toll-free vs. service fee" architecture, solidifying the transition. At the floated rate of $1 per barrel on the ~21 million barrels of petroleum liquids transiting daily, this equates to roughly $7.7 billion annually at full operational flow. This is not a transient disruption cost; it is a perpetual tax on global energy consumption calibrated just below the economic threshold that would force supertankers to divert around the Cape of Good Hope.
C. De-dollarization Signal
The mechanism of settlement for these maritime fees introduces a significant variable into global financial architecture. The requirement that fees be payable in Chinese yuan or stablecoins represents a direct challenge to the petrodollar system. Shippers have already begun utilizing foreign exchange transactions to buy non-domestic renminbi to settle these fees, settling through yuan-denominated intermediaries outside US correspondent banking infrastructure. This establishes an alternative clearing rail that intentionally circumvents the United States correspondent banking system and sanctions architecture.
D. Precedent Risk
The most severe long-term market consequence is the precedent established. By successfully reclassifying transit tolls as "insurance" or "service fees" via the PGSA to navigate UNCLOS, a legal and operational template has been created. If Hormuz monetization holds as a durable international arrangement, the market must assess the probability of similar sovereign monetization efforts at other vital maritime chokepoints, including the Suez Canal, the Strait of Malacca, or the Bosphorus.
SECTION 6 — CLOSE
This analysis has traced a 70-year evolutionary pattern in the market impact of oil-strategic conflict. The dataset demonstrates a clear progression: from the permanent floor repricing of outright supply weaponization in 1973 (Type 1), to the transient spike-and-revert dynamics of kinetic conflicts near infrastructure in 1991 and 2003 (Type 2), to the bridge case of partial supply throttling causing infrastructure regime shifts in 2022.
The 2026 Hormuz conflict introduces the terminal evolution of this sequence: chokepoint monetization (Type 3). By converting the threat of closure into a permanent, toll-based revenue mechanism—validated by the aggressive 60-day interim roadmap secured at Bürgenstock—the controlling entity extracts economic rent without triggering the demand destruction and supply substitution that undermined the embargoes of the 1970s.
This structural innovation leaves capital markets facing a critical, unanswered analytical question: if chokepoint monetization holds as a durable legal and economic mechanism, the next oil-strategic conflict does not need to threaten the actual extraction of supply to extract rent—it only needs to threaten access to the corridor. That represents a structurally different risk environment for global capital than anything observed in the 1946–2026 dataset. The historical patterns that governed portfolio construction and risk modeling around energy conflicts over the past seven decades may now require comprehensive updating to account for a third market outcome, one that is neither the permanent floor repricing of 1973 nor the clean mean reversion of 1991.
REFERENCES
I. 2026 Conflict, Settlement Protocols, and the Strait of Hormuz
Al-Monitor. (2026). US says Hormuz to be toll-free under Iran deal. Al-Monitor.
Al Jazeera. (2026). Trump’s MoU $300bn Iran reconstruction fund becomes US political flashpoint. Al Jazeera.
Al Jazeera. (2026). Trump’s MoU with Iran draws backlash from some Republicans. Al Jazeera.
Al Jazeera. (2026). US, Iran to sign a ‘peace deal’ on Friday: What we know. Al Jazeera.
Al Jazeera. (2026). What we know so far about the US-Iran ceremony in Switzerland. Al Jazeera.
Business Today. (2026). Iran waives Strait of Hormuz fees during 60-day negotiation period with US. Business Today.
gCaptain. (2026). Hormuz Is Reopening. Shipping's Old Playbook Isn't. gCaptain.
House of Commons Library. (2026). US-Iran ceasefire and nuclear talks in 2026 (Research Briefing). UK Parliament.
House of Commons Library. (2026). Iran in 2026 (Research Briefing). UK Parliament.
Middle East Eye. (2026). Iran plans to charge insurance fees to vessels in Hormuz after US deal. Middle East Eye.
Modern Diplomacy. (2026). The Strait as Fault Line: How Iran is Using Hormuz to Farm Sino-American Friction. Modern Diplomacy.
Newsweek. (2026). What’s in Trump’s 14-Point US-Iran Peace Deal? Full Text and Breakdown. Newsweek.
Newsweek. (2026). Strait of Hormuz: Iran will charge fees even after deal. Newsweek.
Shafaq News. (2026). Iran waives Hormuz transit fees for 60 days. Shafaq News.
Splash247. (2026). Hormuz reopens under US-Iran deal amid uncertainty over future transit fees. Splash247.
The Guardian. (2026). Trump signs Iran peace plan, claiming deal averts ‘worldwide depression’. The Guardian.
The Guardian. (2026). Iran announces plans to bring in maritime fees for strait of Hormuz. The Guardian.
The New Region. (2026). Iran says will charge service fees for Hormuz; US expects 'toll-free' access. The New Region.
II. Maritime Mine Disruption and Risk (June 2026)
Howden Group. (2026). Strait of Hormuz Marine War Market: Offering Cover for Vessels in High Risk Areas. Howden Insights.
IHeartRadio. (2026). Tankers' Group Says Hormuz Mines Still Need To Be Cleared. iHeart.
Lloyd's List. (2026). Iran imposes mandatory insurance on ships transiting Strait of Hormuz with fees likely to follow. Lloyd's List Intelligence.
The Guardian. (2026). Hormuz disruption will continue until 80 mines blocking route are cleared. The Guardian.
III. Historical Oil Data and Macroeconomic Reference Series
Brookings Institution. (1986). Lessons from the 1986 Oil Price Collapse. Brookings Institution.
Federal Reserve Bank of St. Louis (FRED). (2026). Crude Oil Prices: West Texas Intermediate (WTI) - Cushing, Oklahoma. FRED, Federal Reserve Bank of St. Louis.
Hamilton, J. D. (2011). Historical Oil Shocks (Working Paper No. 16790). National Bureau of Economic Research (NBER).
Uni Kassel (KOBRA). (2012). Why did OPEC lose its price setting power during the 1980s? The need for a political economy perspective. KOBRA.
U.S. Energy Information Administration (EIA). (2020). Effects of crude oil supply disruptions: how long can they last? U.S. Department of Energy.
U.S. Energy Information Administration (EIA). (2023). Conflict in Libya since 2011 civil war has resulted in inconsistent crude oil production. U.S. Department of Energy.
U.S. Energy Information Administration (EIA). (2026). Cushing, OK WTI Spot Price FOB. U.S. Department of Energy.
Wikipedia. (n.d.). 1980s oil glut. Wikipedia, The Free Encyclopedia.
YCharts. (2026). Iran Oil Production (Yearly) - Historical Data & Trends. YCharts.
YCharts. (2026). Saudi Arabia Oil Production (Yearly) - Historical Data & Trends. YCharts.
IV. International Energy Reserve Actions and Structural Policy Shifts
European Commission. (2026). REPowerEU - 4 years on. European Union.
International Energy Agency (IEA). (2011). IEA makes 60 million barrels of oil available to market to offset Libyan disruption. IEA News.
International Energy Agency (IEA). (2022). 2022 Energy Crisis: Frequently Asked Questions. IEA Analysis.
International Energy Agency (IEA). (2025). European Union – World Energy Investment 2025. IEA Analysis.
Observatoire de l'IFRI. (2011). A Look at the IEA 2011 Release of Strategic Oil Reserves. French Institute of Relations (IFRI).
V. Legal Regimes, Currencies, and Geopolitical Infrastructure
Global Information System (GIS) Reports. (2026). Strait of Hormuz crisis accelerates petrodollar decline. GIS.
Gulf Research Center (GRC). (2026). Chinese Yuan at Hormuz: Iran, China, and the Post-War Monetary Landscape. GRC.
University of Oslo (Jus). (1982). United Nations Convention on the Law of the Sea (UNCLOS). Faculty of Law, University of Oslo.